

Police Dashboard
2018
Information Design | UI Design | UX Design
1 Month
Prototyping, User Research, User Scenarios, Wireframes
Collaborating Departments: Data Science, Development, Project Management
Background
A generic police department faces concerns over officers using excessive amounts of force on civilians, causing lawsuits and other conflicts that tarnish the reputation and credibility of the police department. They want the ability to target the root causes for the excessive uses of force and other uncivil acts not caught under supervision. The goal is to promote good behavior amongst officers and intervene bad behavior before it escalates further.
User Scenario
Dan, a sergeant for a police department, is pinged with several warning signals from the dashboard showing that Mark, a new transfer from another department has been involved in an unusual number of forceful encounters. He digs deeper into Mark’s history, seeing that there are several complaints about this officer, way more than a new transfer should have.
The dashboard shows that Mark is a level 3 threat and has been warned by other leadership to not chase calls and use de-escalation methods. Dan uses the data from the dashboard to conclude that Mark is an impulsive officer who is quick to engage in unnecessary forceful situations.
Sergeant Dan uses the information he has gained from the dashboard to speak with other commanders to address Officer Mark. He is involved in questionable circumstances that may compromise their employment.
User Personas


Officer Mark
The two screens below show Officer Mark’s perspective of his dashboard and the leadership view of Mark’s performance. Leadership can compare Mark to his peers and other squads within the department to manage expectations and measure progress. On Mark’s perspective, he can set his own goals and expectations for himself and see his recent activity to be on top of his actions.


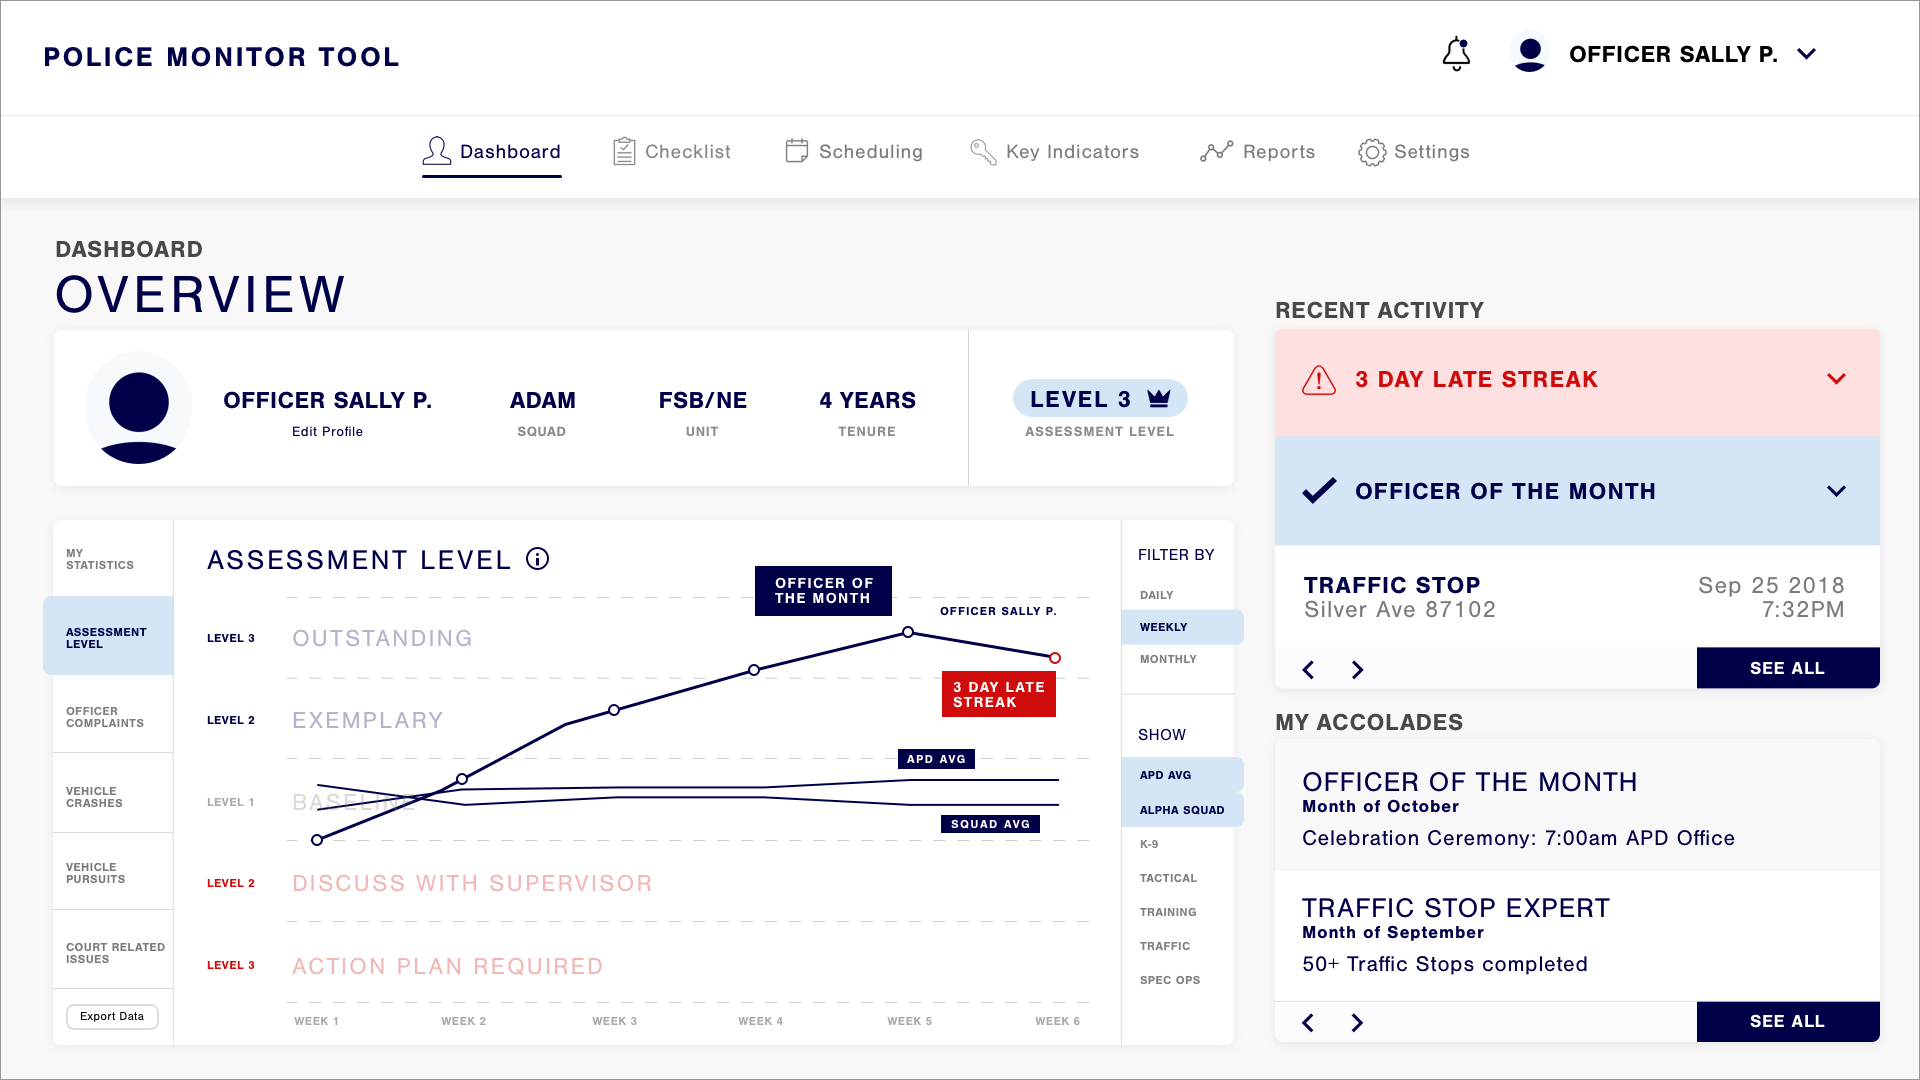
Tipping Point
The screens above show Officer Sally reaching a statistical tipping point, where she has a high likelihood of declining in assessment level based on factors such as too many days without PTO or uncharacteristic car crashes. The tool analyzes patterns based on previous actions and predicts certain tipping points for each officer, giving the department an opportunity to intervene before a situation is escalated.
In this case the tool shows three different scenarios where Sally’s assessment level could either go up, down, or stay the same based on what type of intervention is introduced to her.


Leadership Management
Another feature of the dashboard includes leadership overview of all officers within their squad and a view of department wide policy patterns. This allows leadership to monitor patterns within the department and their own squad to identify pain points within the performance of their unit. This type of information focuses on being accountable for certain actions and analyzing overall trends.

